DOI: 10.17689/psy-2016.2.10
УДК 159.953.6
© 2016 Ershova Regina Viacheslavovna*, Tarnow Eugen**,
*PhD in psychology, professor of Moscow Region State Socio-Humanitarian Institute. Head of the department of psychology (Kolomna, Russia), erchovareg@mail.ru
**PhD, independent researcher (Nj, USA) etarnow@avabiz.com
Annotation: Working memory errors of 193 Russian college students taking the Tarnow Unchunkable Test, utilizing double digit items on a visual display, were analyzed. In three-item trials with at most one error per trial, single incorrect tens and ones digits (“singlets”) were overrepresented and made up the majority of errors which led to a proposed structure of working memory, short term memory and long term memory [Ershova & Tarnow, 2016]. Using a new causality diagram approach we estimate true old errors to occur in about 80% of the singlet errors. We find that the singlet errors can originate in the corresponding item from the previous trial but can also originate in an item from the present trial displayed before or after (but before the recall). Three mechanisms for the singlet errors were considered and none could be excluded. We find working memory regularities which suggest that attention deficits and surpluses may be quantifiable in two parameters: the exponential increase in single errors as a function of the order of presentation and the number of consecutive double errors.
Keywords: working memory errors, integer representation in working memory, memory map, -pointer.
Характеристика ошибок рабочей памяти
© 2016 Ершова Регина Вячеславовна*, Eugen Tarnow**
*доктор психологических наук, профессор, Государственный социально-гуманитарный университет, (г.Коломна, Россия) erchovareg@mail.ru
** PhD, независимый исследователь, (Нью-Джерси, США) etarnow@avabiz.com
Аннотация: В статье представлены результаты исследования рабочей памяти 193 студентов с использованием теста рабочей памяти Тарноу. В сериях, состоящих из 3-х двузначных чисел, большее количество ошибок вязан с неправильным воспроизведением либо цифры десятка, либо цифры единицы, что позволило предположить наличие структуры рабочей памяти (Ершова, Тарноу, 2016). Создание графической модели (каузальной диаграммы) позволило доказать, что в 80% случаев ошибки воспроизведения объясняются интерференцией предшествующих и последующих чисел. Было обнаружено, что ошибка в одной из цифр воспроизводимого ряда может происходить по причине «наложения» чисел предшествующей серии или предшествующих чисел актуального ряда. Ни один из трех описанных механизмов ошибочного воспроизведения не может быть признан несущественным. Мы также обнаружили, что что дефицит и избыточность внимания в процессе функционирования рабочей памяти могут проявляться через два параметра: экспоненциальное увеличение одиночных ошибок как функции от порядка представления чисел и числа последовательных двойных ошибок.
Ключевые слова: рабочие ошибки памяти, целое представление в оперативной памяти, карта памяти, -указатель.
Introduction. Working memory (WM) is considered part of a multi-components model of short-term memory (see, for example, Ershova & Tarnow, 2016), a human ability to work with information which plays an important role in learning from kindergarten to the college years [Alloway, 2010].
We recently introduced a technological development: probing working memory with items that are relatively unchunkable. This led to a proposed structure of working memory, short term memory and long term memory [Ershova & Tarnow, 2016]. This contribution includes a further analysis of well defined errors: those that only occur once per trial. We will consider where do the errors come from? How do they vary with serial position?
The results of our investigation may be important for further understanding the structure of WM, for designing new empirical studies to advance theory and research in this area, as well as measuring the effectiveness of the methodological tools needed to test WM. One can also imagine this venue to be important for pedagogy (e.g. writing web pages and text books with the specific purpose in mind of minimizing WM errors so as to maximize information uptake). We will also argue that it may have a profound importance in understanding part of the phenomenon of dyslexia and may be used to quantify attention.
Method. We present data from a study of university students aged 17 to 24.
The Tarnow Unchunkable Test (TUT) used in this study separates out the WM component of free recall by using particular double-digit combinations which lack intra-item relationships [Tarnow, 2013]. The TUT was given via the internet using client-based JAVAScript to eliminate any network delays. The instructions and the memory items were displayed in the middle of the screen. Items were displayed for two seconds without pause. The trials consisted of 3 or 4 items after which the subject was asked to enter each number remembered separately, press the keyboard enter button between each entry and repeat until all the numbers remembered had been entered. Pressing the enter button without any number was considered a "no entry". The next trial started immediately after the last entry or after a "no entry". There was no time limit for number entry. Each subject was given six three item trials and three four item trials in which the items are particular double-digit integers.
Sample. 193 Russian undergraduate students of the State University of Humanities and Social Studies (121 (63%) females and 71 (37%) males, mean age was 18.8 years) participated in the study for extra credit. Each participant was tested individually in a quiet room. An experimenter was present throughout each session.
One record was discarded – the student had only responded once out of a possible thirty times.
Terms. The terms used in this article are as follows: the displayed items are integers made up of two digits, the subjects create entries. A singlet is the combination of a position and a digit and can be either the ones digit or the tens digit. A trial consists of 3 or 4 displayed items and the overall order of the items is the presentation order. If an item or an entry is divisible by N, N is a factor.
Results. Total number of errors. The number of errors is much larger in the 4-item test (44% of all entries) than the 3-item test (15% of all entries), because 4 items exceeds the average capacity of WM and this leads to problems managing the limited capacity [Baddeley, 2001].
Errors by serial position.
The errors are the fewest for the first item in each group and, on average, increases monotonically till the last item in a group [Ershova, & Tarnow, 2016]. This is true for almost every trial, as can be seen in Fig. 1. The increase is linear for the 3 item test and logarithmic for the 4 item test [Ershova, & Tarnow, 2016].
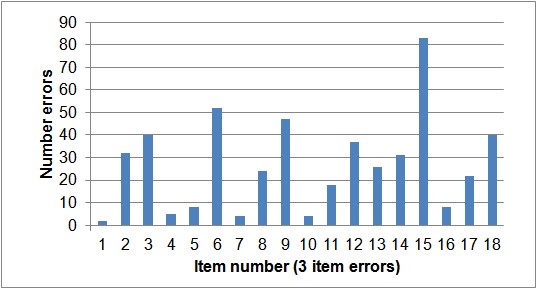
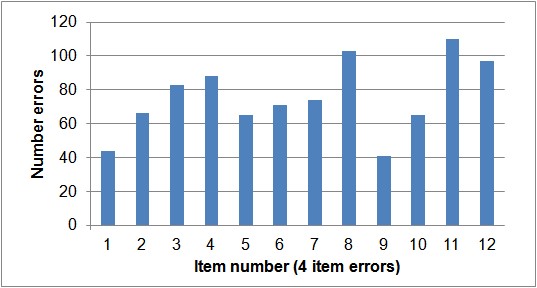
Fig. 1. Errors by order of item presentation. Upper panel shows 3-item errors and the lower panel 4-item errors.
As it seen from the figure, with the exception of the last 4-item trial, the errors all increase monotonically from the first to the last items.
Error categories are not mutually exclusive. For example, if the displayed items are 16 and 29, entries such as 19 and 26 can be errors in the ones digits or, reversing the two entries, errors in the tens digits; and if 19 had been displayed in an earlier set it could have been an “old” error.
To keep the errors as well defined as possible we mostly limit our investigation to three item trials with single errors in each trial. Out of a total of 1146 three item trials, 19 trials included at least one “no entry”, 248 trials had a single errors, 90 had double errors and 13 of the trials had triple errors. We will focus on the 248 trials with a single error.
More complex multi-error trials or four item trials, in which there may be interaction between the errors, will be left for the future analysis.
The restriction to single errors changes the probability of errors as a function of the order of presentation: instead of a linear rise in errors [Ershova, & Tarnow, 2016], the rise is exponential (Fig.2).
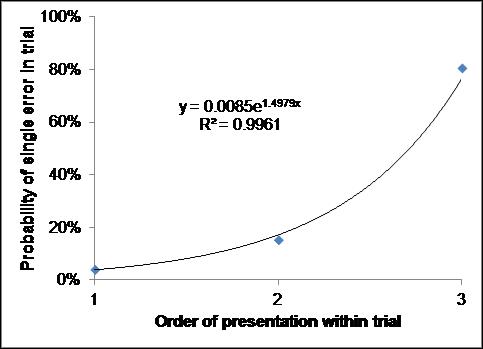
Fig 2. Relative probability of single error as a function of the order of presentation within a trial. The numbers add up to 1.
In Fig. 3 is displayed the probability of a serial position being erroneous if there are two incorrect items. The first serial position is typically correct but the 2nd and 3rd positions are equally likely to be erroneous (chi-square p>0.68).
If these errors derive from a lack of attention, the probability of losing just enough attention to make an error is exponential with the serial position within a trial; since the probability of two errors per trial is equally high for the second and third serial positions within each trial, attention might sometimes be lost at the second item and not regained until the next trial (this is reminiscent of Craik & Lockhart`s levels of processing framework in which the last items in the list have lass chance to be recalled due to superficial processing and lack of attention) [Craik & Lockhart ,1972].
Fig. 3. Relative probability of error if there are two errors in a trial (the probabilities add up to 2 items).
Singlet Errors Are Old. The number of errors of just the tens (ones) digit is 41% (38%) [Ershova & Tarnow, 2016]. A simulation of 12,000 entries in which the third entry was a random number between 21-99 had a much lower number of such errors – 9% (12%). Thus, test errors are much more likely than random numbers to consist of “singlet” errors.
Are these singlet errors random or old (in which previously displayed singlets appear in the error)? This turns out to be a rather complex question to answer and we ask the reader for patience.
We examined the probability of error as a function of the distance between the position of the error singlet and the position of the identical displayed singlet in a “causality diagram”. Negative distances (in which the error shows up before the item is displayed) correspond to chance errors and positive distances correspond to errors from “old” items as well as chance errors. In the causality diagram the order of an entry is defined as 0.5 added to the order of presentation of the last displayed item. With the item order being 1-3, 4-6, … 16-18 the possible positions of errors in our test are 3.5, 6.5, 9.5, 12.5, 15.5 and 18.5 (since they occur between item presentations) and the distances range from -14.5 to 17.5. Negative distances are assumed to be associated with the first presentation of the singlet and positive distances are assumed to be the last prior presentation of the singlet. If an event is associated with both negative and positive distances, the negative distance is discarded. This construct, and the fact that we are working with finite lists and particular sets of displayed numbers, can make random entries seem causal (“contiguity” plots, which tend to exaggerate contiguity, are subject to similar issues as discussed in Tarnow, 2015a).
These artifacts can be seen in Fig. 4, which displays the causality diagram for errors in which either the tens or ones digits, but not both were erroneous from 12,000 random entries for the third item. In both cases, the diagram has a peak at low positive distances which makes it seem as if there are old errors present. There are also nodes for distances with no errors. For example, there is a node at 0.5, corresponding to the impossibility of making an error in the third item which is identical to the third item itself.
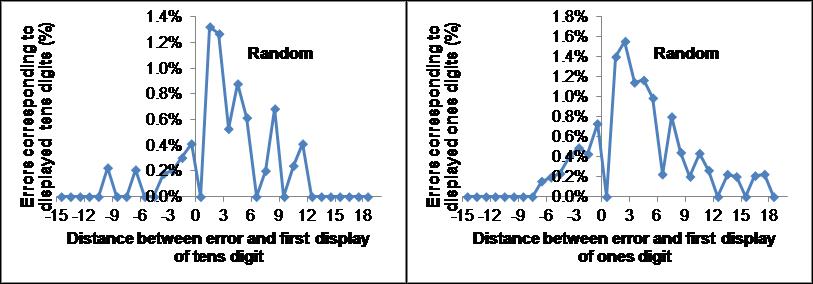
Fig 4. Causality diagrams of errors correspond to random entries in the third position.
In Fig. 5 is shown the causality diagrams for errors consisting of items in which either the tens or the ones digits but not both were erroneous (top row) as well as the corresponding diagrams for 12,000 random entries for the third item with the same scale (2nd row), the ratio between the test errors and random errors (3rd row) and the optimal difference between test and random distributions. Note that the experimental data (top row) are very different from chance (2nd row) in the largest peaks which center at distances of 3.5 for the tens digit and 2.5 for the ones digit. Second, the experimental data are also different from chance for the number of errors at negative, strictly non-causal, distances. We can estimate the number of truly old errors in the two test graphs by using the negative distance frequency as a measure of the non-causal (random) errors and remove this “background” from positive distance frequencies. We fix the multiplicative parameter in front of the background subtraction so there are no causal errors for the random case. This gives us an estimate of 67% true old errors for the tens digit and 90% true old errors for the ones digit. Another estimate can be obtained by removing the random distribution from the test distribution and sum the absolute values, using a normalized factor so that the sum of the absolute values of the differences is minimized (bottom panels in Fig. 5). This gives us 91% true old errors for the tens digit and 75% true old errors for the ones digit. If we average the two methods we arrive at 79% true old errors for the tens digit and 82% true old errors for the ones digit. One of the tens digits was never displayed (and therefore does not appear in the causality diagrams) but nevertheless showed up in errors (4% errors). 5% of old items appeared intact. 16% were non-old item errors for which both digits were incorrect.
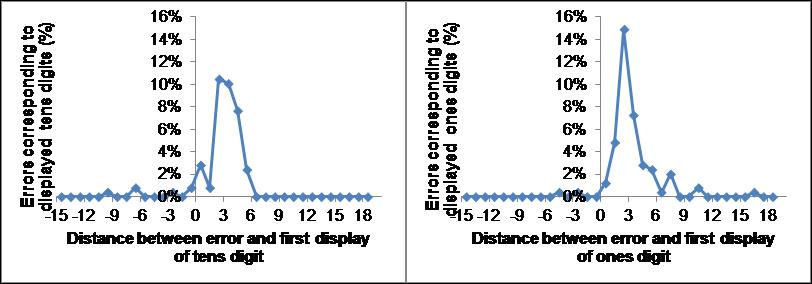
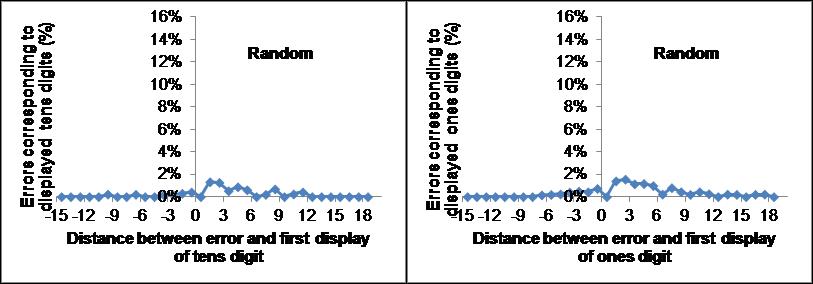
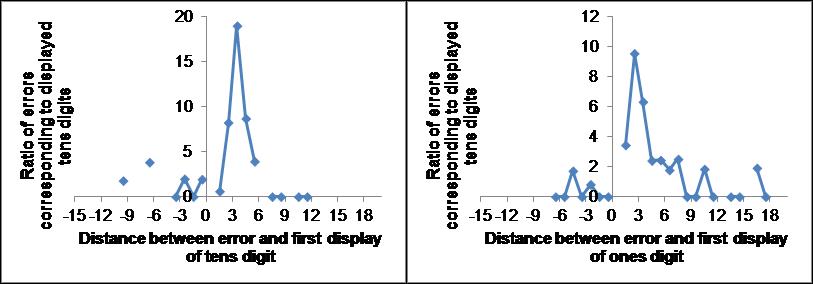
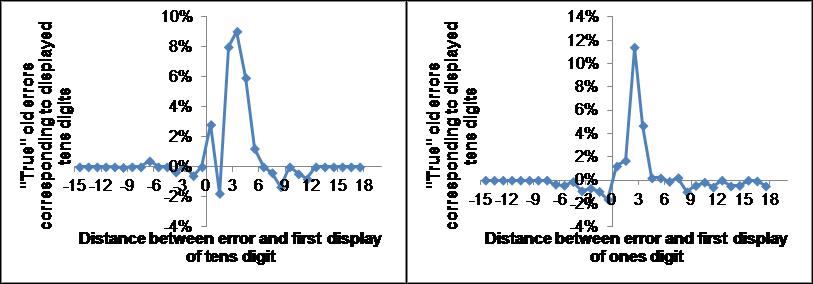
Fig. 5. Causality diagrams of errors. Upper row correspond to experimental data, 2nd row correspond to random entries in the third position, 3rd row correspond to the ratio of test to random and the bottom row displays the optimal difference between test and random distributions resulting in an estimate of true old errors. The left (right) panels display the number of errors from entered tens (ones) digits.
The sources of the tens digit errors are more commonly the 2nd or 3rd items of the previous trial or the first item of the current trial (corresponding to distances of 4.5, 3.5 and 2.5, respectively) while the sources of the ones digit errors are more commonly the 3rd item of the previous trial or the 1st or 2nd items of the current trial (corresponding to distances of 3.5, 2.5 and 1.5, respectively). This difference can also be seen in Fig.6 in which the difference in the -number of errors as a function of distance is displayed (top panel) together with the same diagram for random numbers (bottom panel). Notice that the noise level in the random graph seems higher than for the experimental data, suggesting that the structure in the experimental data is real. This indicates that the two singlets are not only separate but also treated differently. Equivalently, sometimes the presented double-digit items are not each one chunk.
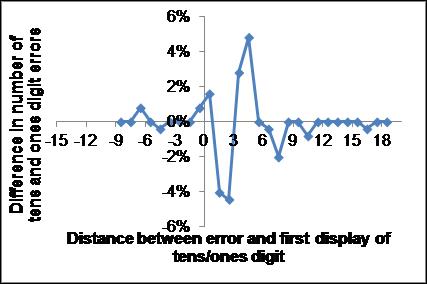
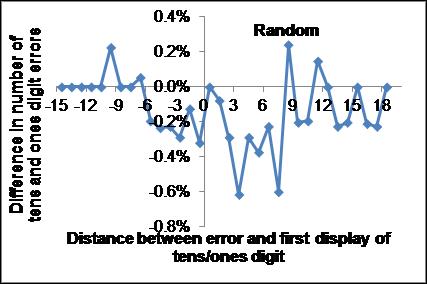
Fig. 6. Causality diagrams of difference between tens and ones digit errors for test data (top) and random data (bottom). Notice the difference in scale and the real structure present in the test data.
Old errors make some the trials effectively longer than three items. Say a tens digit or a ones digit was read in and is destined to become the source of a singlet error after N consecutive correct entries. The length of that sequence is then N+1. Thus, for most subjects WM capacity is 3 items [Ershova & Tarnow, 2016] which means most distances in Fig. 5 should be 3.5 or lower which is indeed the case for the ones errors though the tens errors extend to 4.5 (though it might be limited to those subjects with WM capacity of 4).
Do these errors correlate with behavior? For example, are the subjects aware these entries are errors? One way to gauge this is to check whether the response time increases for erroneous entries [Tarnow, 2015]. To make the comparison well defined, we limited the comparison to trials in which the first two items had been entered correctly. We performed a one-way ANOVA on the logarithm of the third response time (to make the distribution a normal instead of a lognormal distribution) for the correct and error distributions. The result was F (1,912) = 14.3, p = 1.63E-04. It is a statistically significant difference but rather small. The average response times for errors (correct entries) is 7.8 (6.9) seconds which amounts to only a quarter of a standard deviation.
Structure of Working Memory. The over-representation of tens and ones digit errors compared to chance resulted in the memory model of Fig 7.
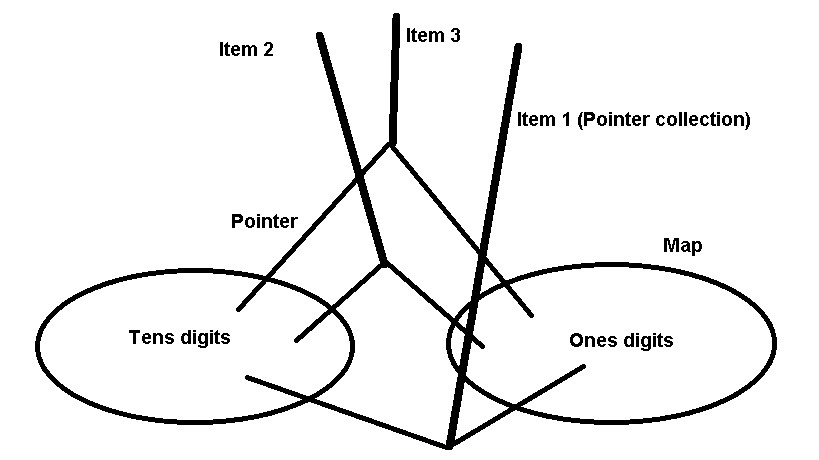
Fig 7. Model of working memory using information from errors. Pointers point to digits within the tens or one digit maps and the pointer collections forms the integers items.
How does the singlet error occur, what is the mechanism of interference? If there are three separate sets of pointers to digits that are read-in and emptied in sequence and the errors occur during the presentation – only one of the displayed singlets is read in and the old singlet from the previous presentation remains - then the erroneous singlets should originate in the previous trial and if the error entry is the third entry, the singlet should be the particular singlet from the third entry of the previous trial. In Fig. 5, upper panel, we would see single peaks at the distance 3.5.
3.5 is indeed a common distance but so are 2.5 as well as 4.5, contradicting this picture; the cannot be the only mechanism.
If the new singlet is not read in [or read in below the threshold needed for a WM items to stay active] and the entry is instead selected from activated singlets from any of the three items, then this selection can occur either at the time of the reading of the items or at the time of the recall entry. If it is the former, singlets displayed later should never occur in the errors, if it is the latter the errors should involve, equally likely, any of the singlets presented before the entries begin. For errors in the third item there would be no possibility of a later singlet being substituted for the missing singlet, for errors in the first item there would be no possibility of an earlier item being substituted for the missing singlet. In Fig. 8 is displayed the causality diagrams of the tens and ones digits using the second item in each trial. The distance 0.5 corresponds to the erroneous digit being selected from an item displayed after the second item. Thus probably some of the tens errors are created after the next item is read in, the ones errors may just be statistical noise.
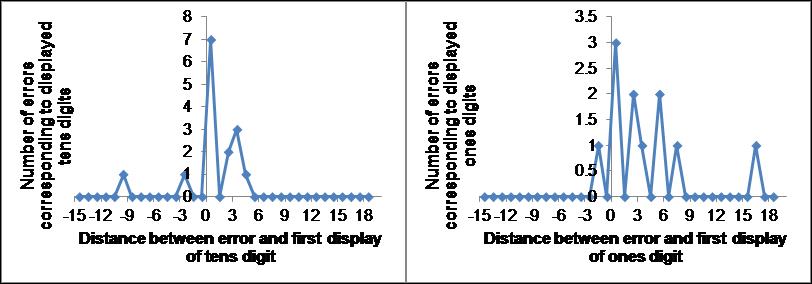
Fig. 8. Causality diagrams of difference between tens and ones digit errors using the entry corresponding to the second item in each trial only. Notice that for both ones and tens digits the distance 0.5, corresponding to the erroneous digit coming from the third item in each trial, is large.
Errors as a function of trial. One might expect that the error rate for each trial set as displayed in Fig. 10 would be constant. However, the fifth set seems to have a rather large error rate. This is borne out by a one way ANOVA (p<1.3*10-10) of the underlying data and chi-square of the sums<5*10-8. If we further subdivide into single, double and triple errors we have the results (see Fig. 11) – each subdivision deviates from the null hypothesis. Thus, the particulars of the displayed items matter greatly and have different impact on single, double and triple errors.
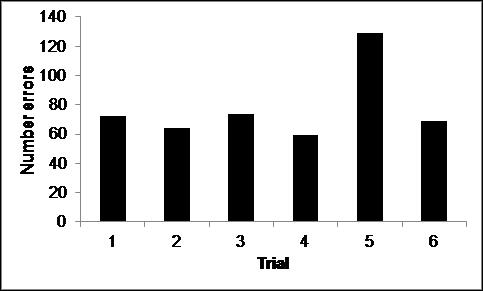
Fig. 10. Errors as a function of trial [three items per trial, six trials in the experiment]. Chi-square of totals <5*10-8
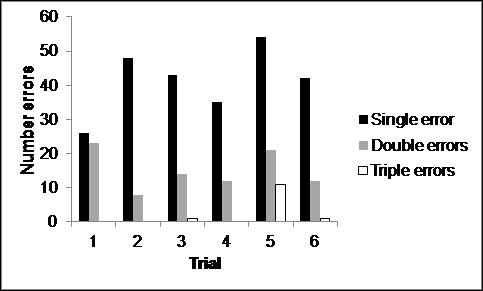
Fig. 11. Errors by type as a function of trial [three items per trial, six trials in the experiment]. Chi-squares<0.039, 0.048, 2.6*10-8 for single, double and triple errors.
Discussion. In order to simplify the study of the errors, avoiding error-error interactions and keeping errors well defined, we limited the selection to those of three item trials in which only one error occurred.
We found that the majority of singlet errors are “old”, stemming from items displayed earlier, the sequence typically being within the WM capacity determined earlier [Ershova & Tarnow, 2016], which reaffirms the WM capacity measure. We were able to investigate the mechanisms of proactive interference. We were not able to eliminate any of these three mechanisms: a single could be kept from the previous item and then remain in spite of the new item, a choice of the singlet could be made from an item displayed either before or after the new item (but before the recall).
We found that the tens digit errors and the ones digit errors are not following the same history: old tens digit errors can be traced to items displayed a little earlier than old ones digit errors. We also found that the response times were statistically significantly larger for responses with errors but that the difference was small, perhaps too small for the subjects to be aware of making these errors.
The number of errors (in the three item trials with a single error) increased exponentially with serial position within each trial; it is not clear why. If these errors derive from a lack of attention, the probability of losing just enough attention to make an error is exponential with the serial position within a trial. Since the probability of two errors per trial is equally high for the second and third serial positions within each trial, attention might sometimes be lost at the second item and not regained until the next trial. Both of these properties may be useful in quantifying attention deficits and surpluses in clinical settings.
Limitations. We have limited ourselves to analyzing only trials with three items with single errors, it could be that trials with multiple errors or with a different number of items would show evidence of a different memory architecture. More fundamentally, had we studied other items [listed in Cowan, 2012, 2014], a different structure may have emerged as well.
References:
- Alloway T.P., Alloway R.G. Investigating the predictive roles of working memory and IQ in academic attainment// Journal of Experimental Child Psychology. –2010. –№ 106. – P.20–29.
- Baddeley, A. D. Is working memory still working? // American Psychologist. –2001. – №56 [11]. –P.851.
- Cowan N. & al. Central and peripheral components of working memory storage// Journal of Experimental Psychology: General, –2014. –№143 [5]. – P.1806.
- Craik F. I., Lockhart R. S. Levels of processing: A framework for memory research// Journal of verbal learning and verbal behavior. –1972. – №11 [6]. – P. 671-684.
- Ershova R., Tarnow E. Working Memory capacity test reveals subjects' difficulties managing limited capacity// Bulletin of the Peoples’ Friendship University of Russia. – 2016. – №. 3. – P. 14-20
- Tarnow E. U.S. Patent Application No. 14/066,195. – 2013
- Tarnow E. Retrieval process in free recall creates errors in short-term memory but not in long-term memory// Bulletin of the Peoples’ Friendship University of Russia. – 2015. – №. 2. – P. 54-57.
- Tarnow E. Contiguity is limited in free recall. Unpublished. See https://www.researchgate.net/publication/274700056_Contiguity_is_limite…– 2015а.
- Tarnow E. First direct evidence of two stages in free recall and three corresponding estimates of working memory capacity// Bulletin of the Peoples’ Friendship University of Russia. – 2015b. – №. 4. – P. 15-26.